Difference
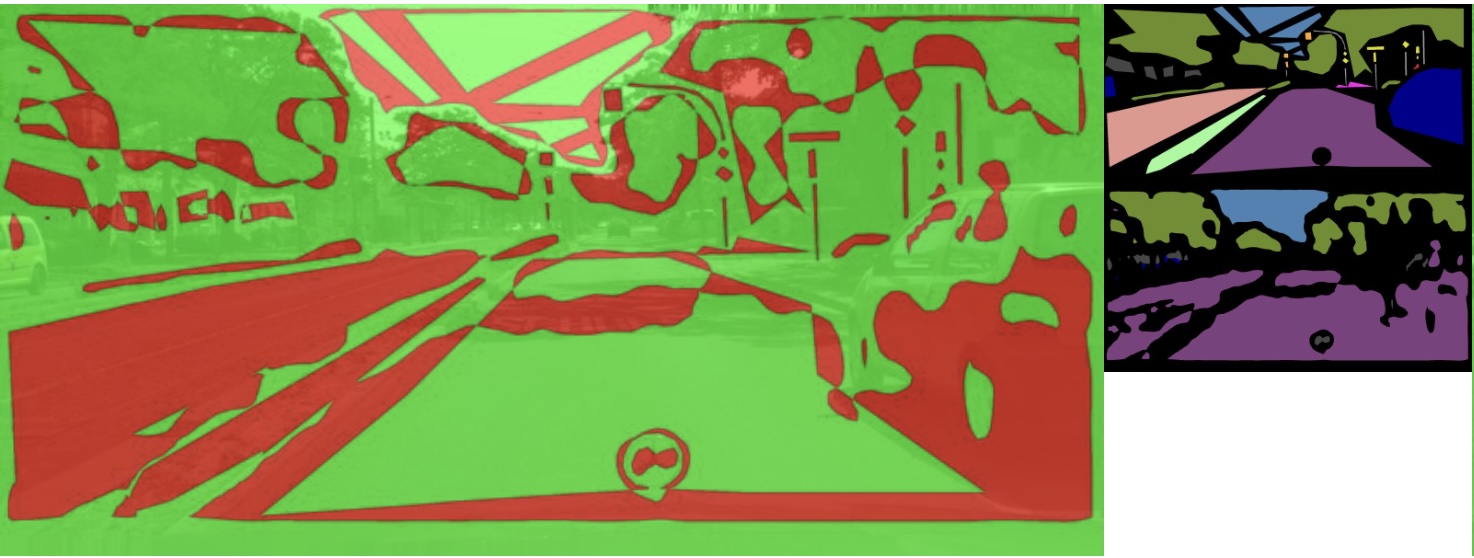
Highlight every pixel where two model inferences agree or disagree.

Next step in Data Visualization
Transforming the way machine-learning teams interact with and understand complex model output.
Original introduction
The original walkthrough remains the clearest introduction to the problem and the workflow.
The original product
GoodModelBadModel brought model output, ground truth, comparisons, and error analysis into one visual workflow.
Highlight every pixel where two model inferences agree or disagree.
See exactly where a newer model improved, regressed, or changed without becoming more accurate.
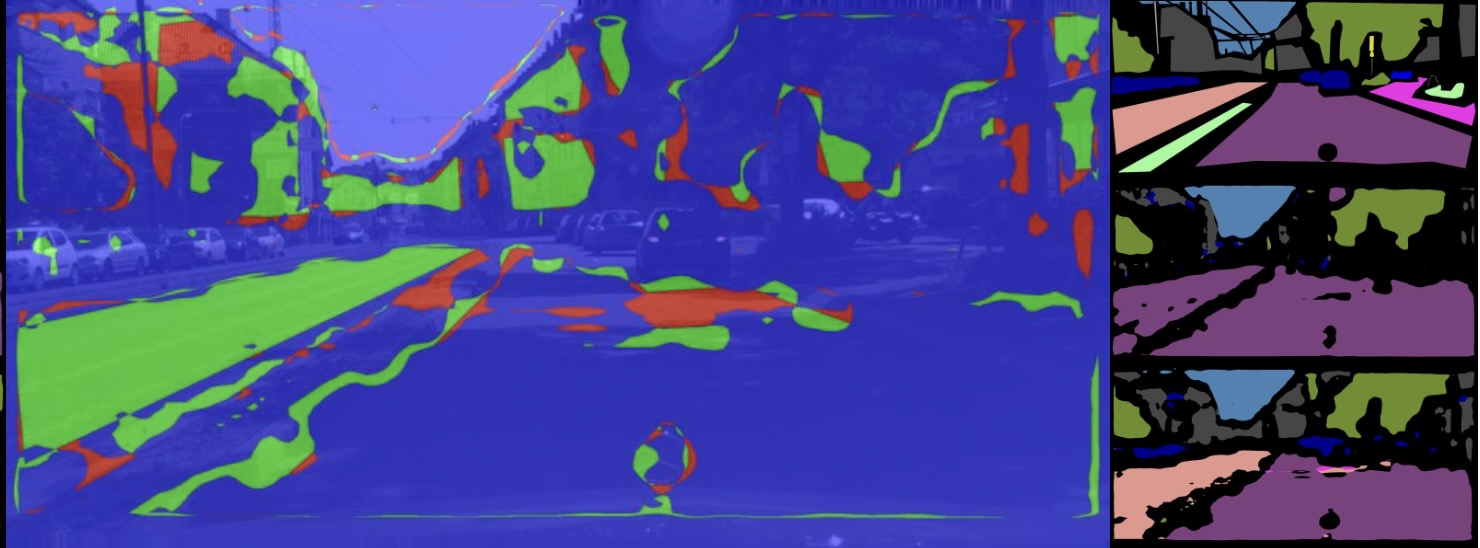
Understand which semantic classes a model confuses within an individual image.
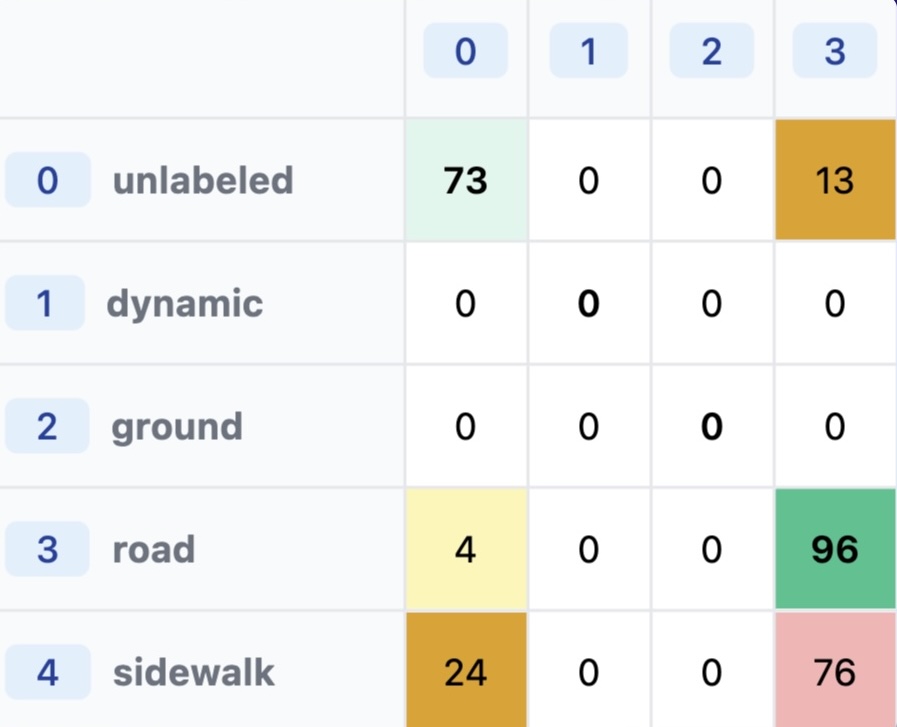
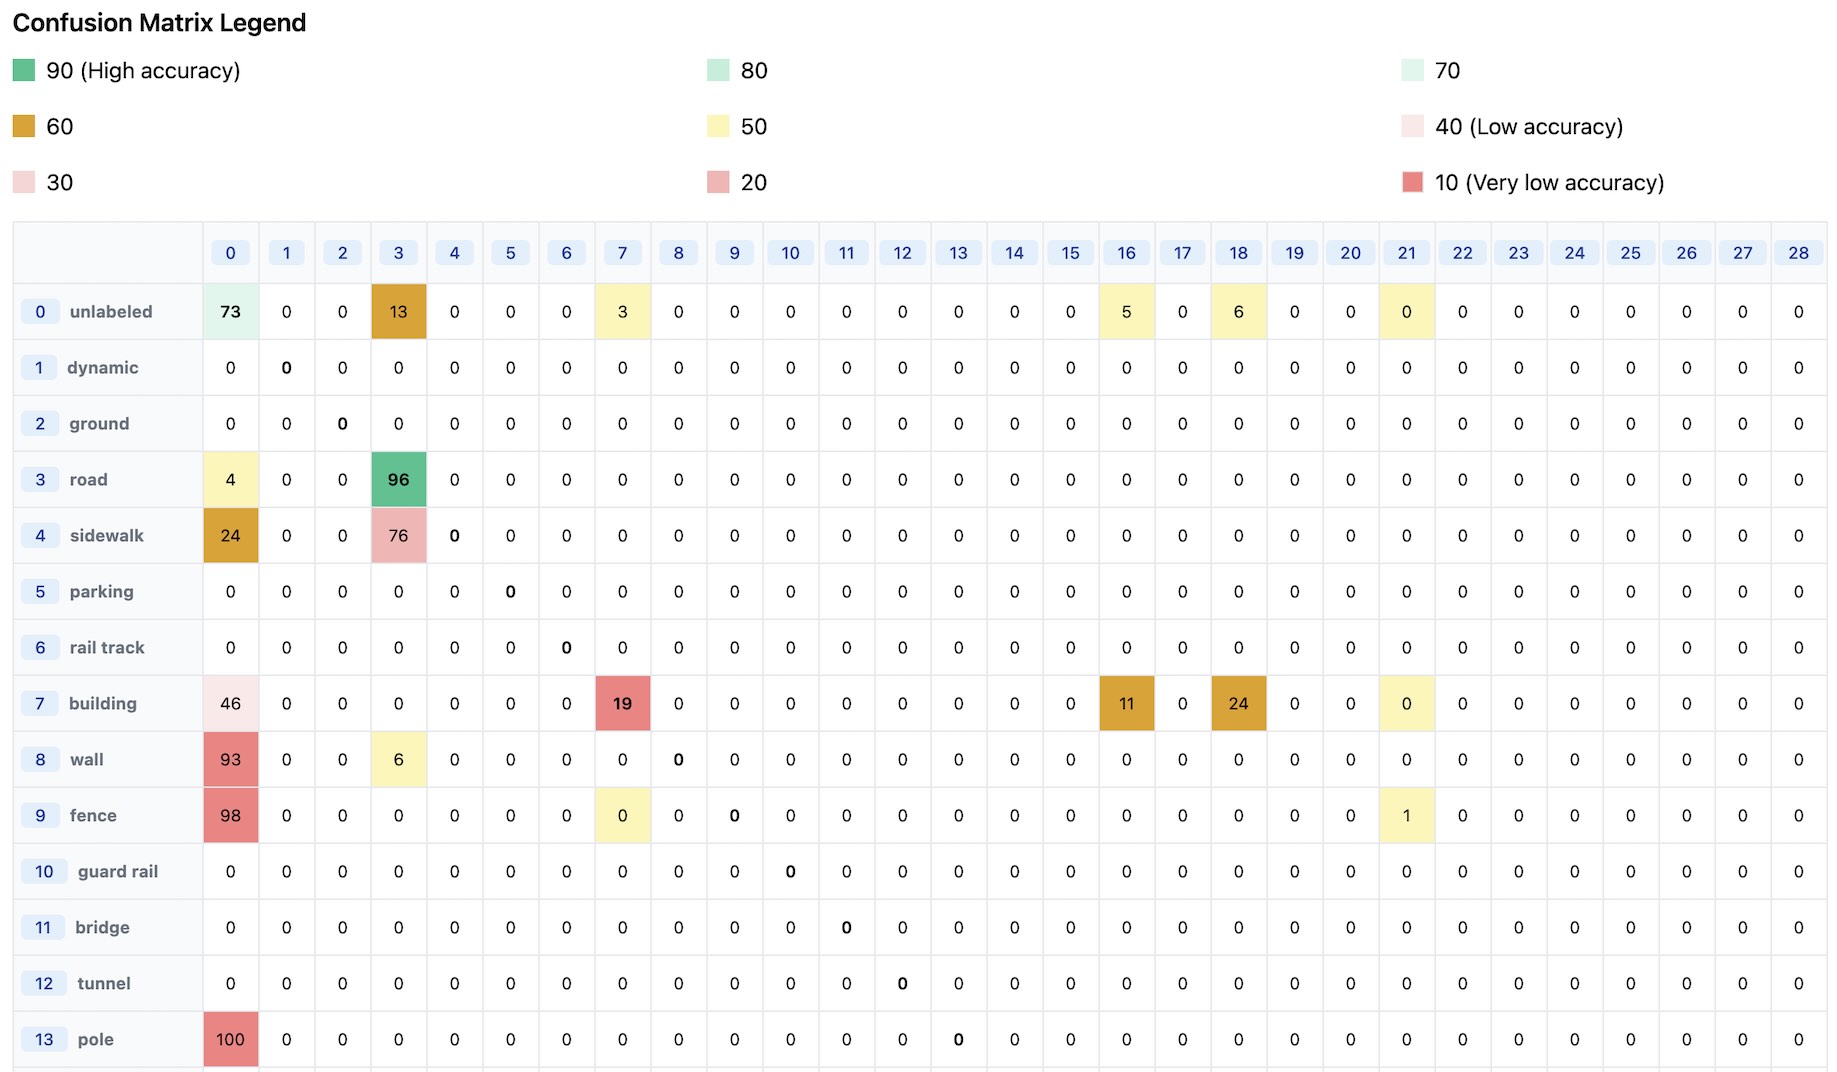
Aggregate the evidence across a dataset and compare model behavior at a glance.
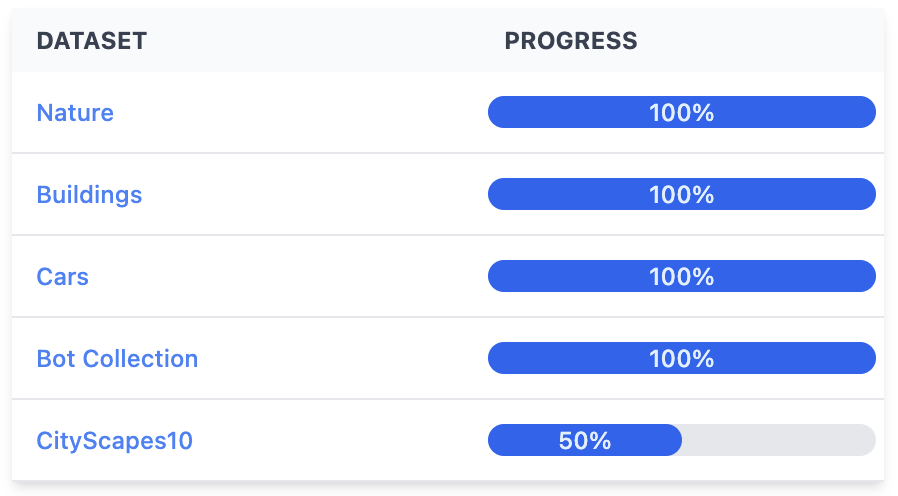
The live product managed images, ground truth, and multiple model runs as reusable datasets.
Interactive archive
Pick a frame, switch views, and inspect the visual evidence. All computation happens locally in your browser—there is no account or backend.
Current frame
Rows are ground-truth classes; columns are predictions. Darker cells contain more sampled pixels.

Preserved product experiment
The commercial service is retired. This archive preserves the problem, the interaction model, and a working slice of the product as part of Andriy Drozdyuk's portfolio.